Andreas StöcklinDataDrivenInvestorNew Paper from Google DeepmindGrandmaster-Level Chess Without Search3 min read·Apr 18, 2024----
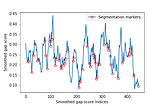
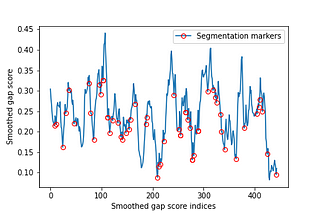
Andreas StöcklinDataDrivenInvestorDocument SegmentationA Method with Sentence Embeddings3 min read·Mar 26, 2024----
Andreas StöcklinDataDrivenInvestorNew Jailbreak Method for Large Language ModelsUsing ASCII Art2 min read·Mar 10, 2024----
Andreas StöcklinDataDrivenInvestorExploring the Horizon of Self-Improving AIArtificial intelligence has witnessed a paradigm shift with the introduction of Self-Rewarding Language Models (SRLMs), a groundbreaking…2 min read·Jan 20, 2024----
Andreas StöcklinDataDrivenInvestorExploring the Frontier of AI Vision: The Rise of Autoregressive Image Models (AIM)The Dawn of a New Era in Visual AI3 min read·Jan 17, 2024----
Andreas StöcklinDataDrivenInvestorNavigating the Next Wave: The Future of Large Language Models in 2024Exploring Emerging Trends in Efficiency, Open-Source Development, and Ethical AI3 min read·Dec 31, 2023----
Andreas StöcklinDataDrivenInvestorPocket-Sized RevolutionApple’s Breakthrough in LLM on the iPhone and Its Implications for the Tech Industry3 min read·Dec 22, 2023----
Andreas StöcklinDataDrivenInvestorComparing Aleph Alpha and Mistral AIA Deep Dive into European AI Innovation3 min read·Dec 13, 2023----
Andreas StöcklinDataDrivenInvestorUnderstanding the Mechanisms of In-Context Learning in Large Language Models: Benefits and…In recent years, In-Context Learning (ICL) in Large Language Models (LLMs) has emerged as a powerful learning paradigm. However, the…3 min read·Oct 26, 2023----
Andreas StöcklinDataDrivenInvestorLanguage Models: Unveiling the Secrets of Space and Time4 min read·Oct 14, 2023----